
Bharti Airtel is a second giant experiencing a similar breakout after a triangle consolidation for pretty long period. The earlier breakout was by Reliance Industries around a year back. I had written a post during the breakout phase on Dec 27, 2016, in Reliance Industries. Reliance Industries doubled since then. Below is the link of that post-
Reliance Industries Ascending Triangle
First picture below is a Quarterly Candlestick chart. I love using Monthly and quarterly charts. They give a clear picture at a larger scale. Once we get this helicopter view, we understand what is happening and what can be expected in the times to come.
You can see below that the stock has formed a long triangle beginning in Jan 2007 and since then was trading in the consolidation till Sep 2017. Since the period is too long and the chart we are considering here is a quarterly chart, the low and high of the consolidation too is large. The base of this consolidation is around 260 and the top is around 500.
The triangle went narrow during the quarter ended Sep 17. Finally the stock broke out of the consolidation in Oct 17. You can see on the chart when the quarter in ended Dec 17 formed, a huge green candle supported by increased volumes.
I have also produced a Line Chart below to understand the picture more clearly.
Current markets pressures have brought the stock back to its breakout levels of around 425, where the stock is currently trading.

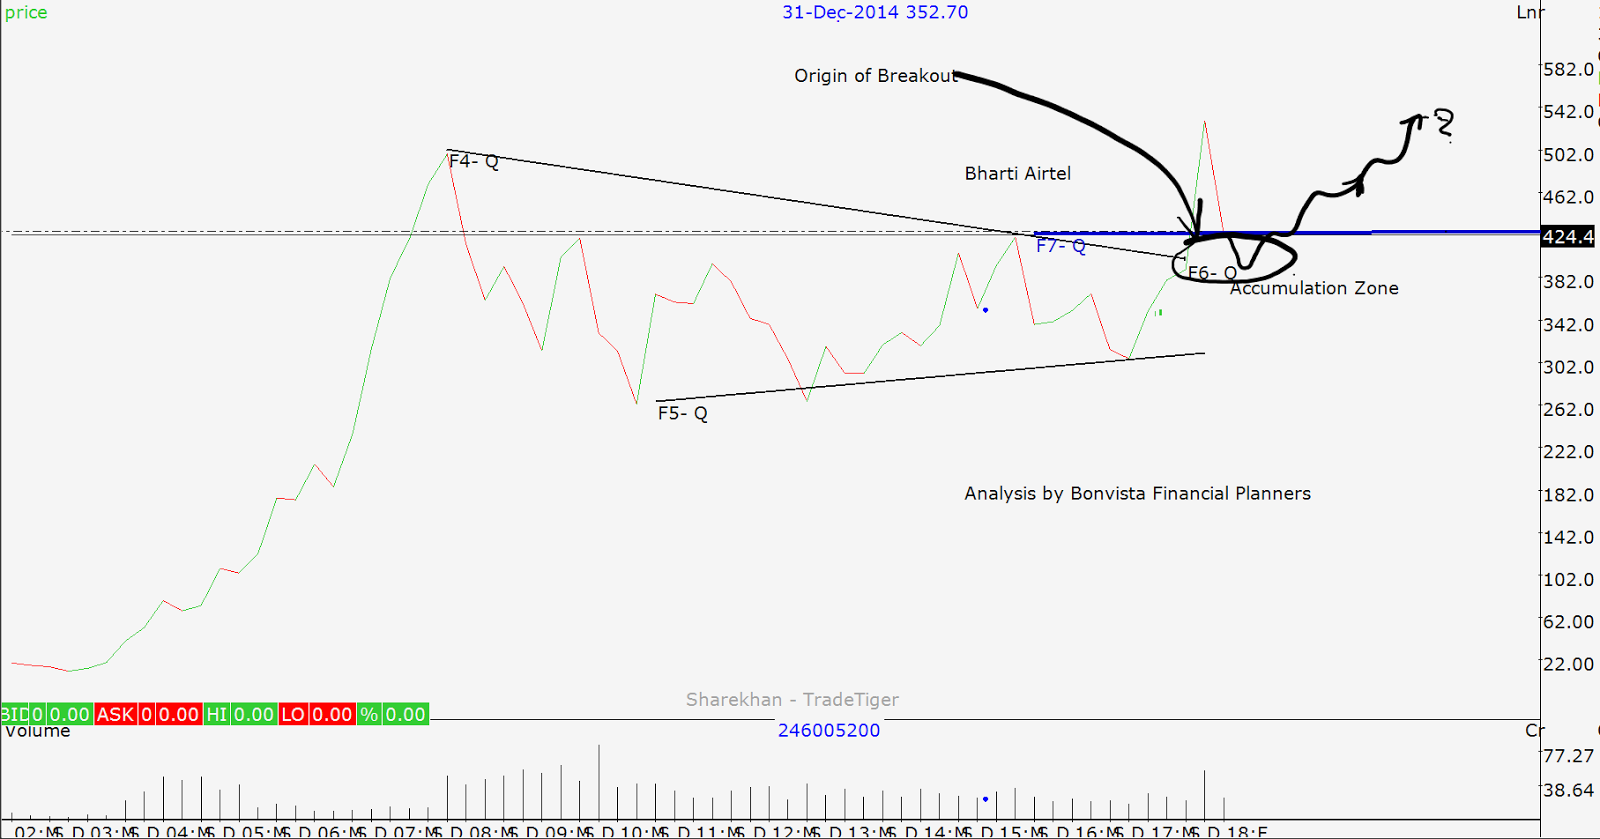
The stock after breaking out has corrected to test the level of breakout, as it usually happens in most breakout examples. This is an entry opportunity.
I have produced a weekly chart below which is showing the origin of breakout and how it is currently trading near the same level after a fall of around 20%. This fall brought the stock back to its support near 424 which also the origin of the breakout.
We have experienced that this is an opportunity to accumulate the stock.
This zone is between 424 to low of around 380. If the stock fails to sustain above 380, we may consider failure of the pattern. Remember that the patterns can fail, not usually though.
The stock has a potential to move from this level and the gains can be handsome. Though we can not predict the targets we believe that the stock can achieve first possible level of 530 and then 650 and then 840.

Chart Credits: Sharekhan Trade Tiger
Disclaimer: The contents produced here are purely for educational purpose. They should not be construed as buy/sell recommendations. I am not a SEBI registered Analyst or Investment Advisor. Readers are advised to consult their Investment advisor before taking any decisions based on above write-up.